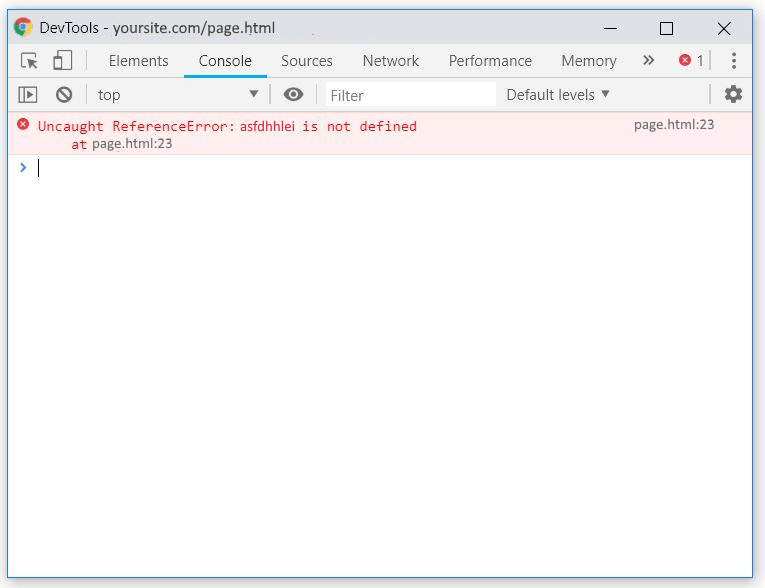
When troubleshooting website problems, you may be asked to check for errors in your browser’s console or to use the inspector. Each browser has its own method(s) of navigating to the Console. Listed here are the most common ways for each of the main browsers.
Tip: If you forget which keys work with which browser, try pressing the F12 function key, since many browsers open the Developer Tools with this key. From there, you can click on the Console tab located in the DevTools window.
Chrome: Press CTRL+SHIFT+J (Windows) or CMD+OPT+J (Mac) opens the DevTools window right to the Console tab.
The window will look similar to this, showing any errors in red, with the location and line number where the error occurred.

Firefox: CTRL+SHIFT+K (Windows) or CMD+OPT+K (Mac)
IE/Edge: F12
Safari: CMD-OPT-C (only works if the “Show Develop menu in menu bar” check box in the Advanced tab of the Preferences menu is checked).
Opera: CTRL+SHIFT+I (Windows) or CMD+OPT+I (Mac), then click the Console tab
